Essential Financial KPIs for Any Business Growth in Nigeria
Understanding your numbers can feel like trying to read a map in a language you barely speak. But in business, those numbers are more than just details; they’re your guide, your early warning system, and sometimes your wake-up call. They show where you're thriving, where you're bleeding money, and where you need to pause and make better choices. This is where financial KPIs come in; financial KPIs (Key Performance Indicators) are specific measurements that help you understand how your business is performing financially. They’re not just opulent business terms. They're the basic truths that reveal if your business is stable, profitable, or at risk.
Think of them as the vital signs of your business. Just like a doctor checks your blood pressure, temperature, and heartbeat to assess your health, financial KPIs check your revenue, profit margins, cash flow, and spending habits to tell you if your business is in good shape or heading for trouble.
What makes them so powerful is that they take emotion out of the equation. No matter how passionate you are or how busy things feel, the numbers don’t lie. They’ll show you if your prices are too low, if your overhead costs are too high, or if you're burning through cash faster than you’re earning it. They’ll also show you where you’re doing well, where growth is happening, where customers are spending, and what strategies are working.
The beauty of financial KPIs is that they give you clarity. You don’t have to wonder if you’re doing okay; you will know. You can plan your next move with confidence instead of hope. And when unexpected things happen, like a slow sales month or a supplier cost increase, you’ll have the numbers to back up your decisions and adjust quickly.
Many business owners ignore these signals until it’s too late. They trust their instincts and keep pushing forward, thinking more sales will fix everything. But when you don’t understand your numbers, you can make moves that will hurt you more than help, like cutting the wrong costs, launching the wrong products, or scaling too fast without enough resources to handle the pressure.
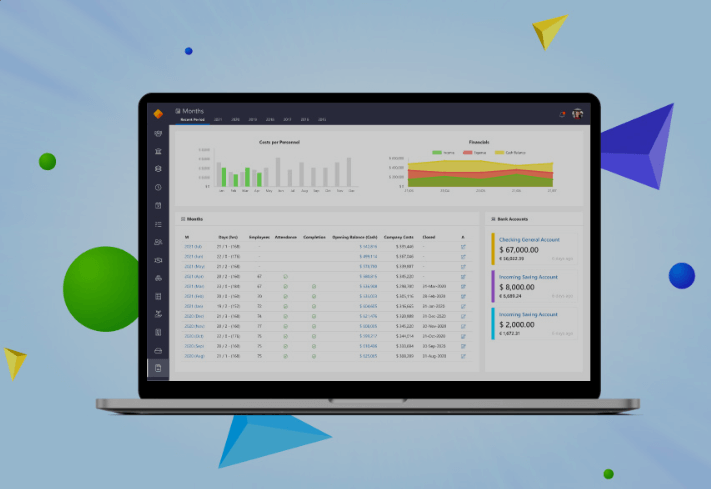
Financial KPIs are the difference between being busy and being effective. Between reacting and leading. Between guessing and knowing. They help you see the full picture, not just the highlights. And with tools like Tradift, you don’t have to do it all manually or stress over complicated spreadsheets. You can track the numbers that matter and get real insights, so you can take smarter steps forward. So no, you don’t need to become a financial expert. But understanding your key numbers can turn your side hustle into a business that grows with purpose and profits that last.
What Are Financial KPIs?
Financial KPIs are the key numbers that speak for your business when words can’t. They tell you the truth about how you’re doing, whether your business is healthy, growing, leaking money, or stuck in place. They're like your business’s financial insights, showing you what’s working, what needs fixing, and where you're heading. But more than just numbers, financial KPIs are your decision-making tools. They give you the confidence to make bold moves, like hiring a new staff member, expanding to another city, restocking high-demand items, or even applying for funding. When your numbers are clear, your decisions become smarter.
These KPIs come straight from your financial activity: the sales you make, the expenses you pay, the profits you earn, and the cash you manage daily. They help you see if you’re actually making money, how fast your business is growing, how efficiently you're running things, and whether you’re ready for the next level or need to pause and adjust.
Essential Financial KPIs for Business Growth in Nigeria
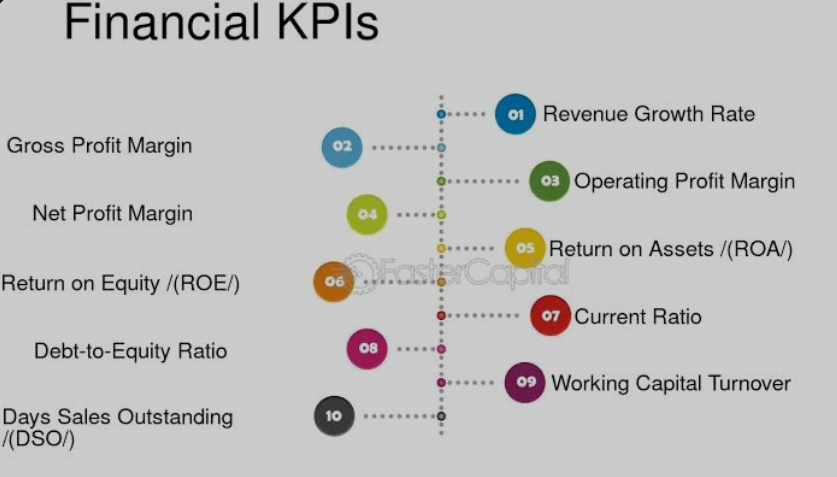
1. Revenue Growth Rate
Revenue Growth Rate simply tells you how fast your business is growing when it comes to sales. It shows the difference between how much money your business made during one period, like last month or last quarter, compared to the one before it. If your revenue is going up, it means more customers are buying what you’re selling. That’s a good sign! It means your brand is gaining attention, your marketing might be working, and customers are responding well to your products or services.
If your revenue isn’t growing, or worse, it’s dropping, that’s your sign to dig deeper. Maybe your ads aren’t reaching the right customers. Maybe your prices need adjusting. Or maybe it’s time to introduce something fresh to spark new interest.
This shows how much your sales are increasing over time, like watching a plant grow taller week by week. It’s not just about how much you made, it’s about how much more or less you made than before. This number is important because it reflects momentum. Investors, business partners, and even you, as the owner, want to know if this business is moving forward, standing still, or slowing down? It’s calculated like this:
This period’s revenue – Last period’s revenue ÷ Last period’s revenue × 100
So, if you earned ₦500,000 this month and ₦400,000 last month, your revenue growth rate is:(₦500,000 – ₦400,000) ÷ ₦400,000 × 100 = 25%.
That means your revenue grew by 25%, a solid sign that things are picking up.
2. Gross Profit Margin
Gross Profit Margin tells you how much money you keep from each sale after you’ve covered the cost of making or buying the product you sold. It’s not the total money you collected, but it’s what’s left after subtracting the cost of the item itself.
If you sell a product for ₦10,000, but it costs you ₦6,000 to buy or make that product, you didn’t earn ₦10,000; you earned ₦4,000. That ₦4,000 is your gross profit, and your gross profit margin tells you what percentage of the sale that is. It’s calculated like this:
(Sales – Cost of Goods Sold) ÷ Sales × 100
Using our example:
(₦10,000 – ₦6,000) ÷ ₦10,000 × 100 = 40%
That means your gross profit margin is 40%, which tells you that for every ₦100 you make in sales, you’re keeping ₦40 after paying for the product.
3. Net Profit Margin
Net Profit Margin is the real truth-teller of your business. It shows exactly how much money you keep after paying for everything, not just the cost of your product, but also your rent, staff salaries, marketing, delivery, internet bills, bank charges, taxes, and more.
You’ve made a sale, paid for the product, sorted your delivery, paid your staff, boosted your ads, and cleared your bills. Whatever is left after all that? That’s your net profit. And Net Profit Margin is the percentage of your total sales that turns into this final profit. It’s calculated like this:
Net Profit Margin = Net Income ÷ Sales × 100
Let’s say your store made ₦500,000 in total sales, but after paying for everything, COGS, rent, staff, marketing, and taxes, you’re left with ₦75,000.
₦75,000 ÷ ₦500,000 × 100 = 15%
That means your net profit margin is 15%, so for every ₦100 you earn in sales, you’re keeping ₦15 as true profit.
This KPI is a powerful tool because it tells you whether your business is actually making money or just breaking even. You can be super busy, processing lots of orders, but if your costs are eating into your revenue, your net profit margin might be disappointingly low. But once you know your net profit margin, you can start pricing intentionally. You can work backwards, decide how much you want to earn, factor in your costs, and set prices that make sense for your market and your bank account.
Different industries have different margins. Supermarkets might run on 1-2%, while digital or software businesses might enjoy 30% or more. What matters most is that your margin is healthy, consistent, and aligned with your business goals.
4. Operating Cash Flow
Operating Cash Flow is the actual cash your business brings in from daily activities, like selling products and getting paid, after covering routine expenses. It shows whether your business generates enough real cash to keep running without needing loans or outside help. And you asked yourself, Can my business sustain itself with the money it makes every day? Imagine you run an online store selling household products. You’re getting orders, you’ve stocked your inventory, and you’re delivering to customers. All that activity, selling, restocking, delivering, and getting paid, is part of your core operations. OCF looks at how much cash is flowing in and out through this daily process.
Sometimes, your business looks profitable on paper, but the cash isn’t there yet. Maybe you sold ₦1,000,000 worth of goods, but most customers haven’t paid yet. Or your cash is stuck in unsold inventory. That’s where OCF steps in to keep it real. It adds to your net income your total earnings. Adjusts for non-cash expenses like depreciation, i.e., the value of assets going down over time, and includes changes in working capital, things like inventory levels, unpaid invoices, or bills you haven’t paid yet. It’s calculated like this:
Operating Cash Flow = Net Income + Non-cash Expenses + Changes in Working Capital
OCF is very important because even profitable businesses can run into trouble, such as not having enough cash on hand to pay salaries, buy stock, cover delivery, or pay rent. It shows if your business is earning enough real money every day to keep itself alive and growing, without borrowing or begging. It’s one of the strongest signs of financial health and sustainability. When your OCF is solid, you can plan for growth, weather tough months, and make great investments with confidence.
5. Current Ratio
Current Ratio tells you how well your business can pay off its short-term debts using the assets it already has on hand, like cash, inventory, or customer payments you’re expecting soon. If your business has bills to pay in the next few weeks or months, like supplier invoices, staff salaries, or utility bills, the current ratio checks if you have enough liquid assets to cover them without scrambling or borrowing. It’s calculated like this:
Current Ratio = Current Assets ÷ Current Liabilities
So, if your ratio is 1 or higher, it usually means you can comfortably pay off what you owe in the short term. A ratio below 1 means you might not have enough easily accessible money to cover your upcoming obligations, and that could put your business under pressure.
6. Churn Rate
Churn Rate shows how many customers stop buying from your business within a certain time, whether they cancel a subscription, stop ordering, or simply disappear. It helps you understand how well you’re keeping your customers. It’s calculated like this:
Churn Rate = Customers Lost ÷ Total Customers × 100
For instance, if you had 100 customers at the start of the month and lost 10 by the end, your churn rate is 10%.
Churn rate is like a warning light. The higher your churn rate, the more customers you’re losing, and the more money you may be missing out on. Keeping your churn rate low means happier customers and more stable growth.
7. Customer Acquisition Cost (CAC)
Customer Acquisition Cost (CAC) is the total amount of money your business spends to bring in one new customer. It includes things like ads, promotions, social media campaigns, and any costs tied to getting someone to buy from you for the first time. Customer acquisition cost is calculated like this:
CAC = Total sales & marketing costs ÷ Number of new customers added
If you spend ₦100,000 on ads and gain 100 new customers, your CAC is ₦1,000 per customer, which helps you know if your marketing is working well and if you're spending wisely. A lower CAC means you're gaining customers without burning cash. A high CAC might mean you're overspending to get sales, which can hurt your profits.
8. Customer Lifetime Value (CLV)
Customer Lifetime Value (LTV) is the total money you expect to earn from a customer throughout their entire relationship with your business. It shows how valuable a customer is, and not just from one sale, but over time, especially if they keep coming back. It’s calculated like this:
Average purchase value × Purchase frequency × Customer lifespan = LTV
That is, if someone buys from you every month for two years, their LTV is much higher than someone who only buys once. LTV helps you decide how much is smart to spend on ads, marketing, or loyalty rewards, because it tells you how much that customer is worth to your business.
9. Burn Rate
Burn Rate is the amount of money your business is losing each month, especially before you start making enough to cover your expenses. It tells you how fast your cash is “burning” or running out. Burn rate is calculated like this:
Net burn rate = Monthly operating expenses – Monthly revenue
For instance, if your business spends ₦1,000,000 every month but only earns ₦300,000, your burn rate is ₦700,000. That’s how much you’re losing monthly, and it shows how long your current cash can keep your business running before you need to make a profit or raise more money.
10. Return on Investment (ROI)
Return on Investment (ROI) tells you how much profit you make from the money you spend on something, like a project, product, or marketing campaign. It shows whether the money you put in is giving you more money back or just draining your budget. It’s calculated like this:
ROI = (Net Profit – Cost of Investment) ÷ Cost of Investment
Then multiply the result by 100 to get a percentage.
For instance, if you spend ₦50,000 on a Facebook ad campaign and make ₦150,000 in profit from it: ROI = (₦150,000 – ₦50,000) ÷ ₦50,000 = 2 x 100%
That’s 200% ROI, meaning you earned back 2x what you spent.
11. EBITDA
EBITDA stands for Earnings Before Interest, Taxes, Depreciation, and Amortization. It’s a financial metric that shows how much money your business makes from its core operations, before subtracting things like loans, taxes, and the aging of your assets, both physical and intangible. EBITDA is calculated like this:
EBITDA = Net Earnings + Interest + Taxes + Depreciation + Amortization
It removes costs that don’t reflect your day-to-day business operations, so you can see how profitable your actual work is. It also gives you a clearer view of how much cash your business is really generating from operations, without distractions like tax rules or equipment wear-and-tear. It’s especially helpful when comparing businesses or trying to attract investors, because it shows your raw profit potential.
12. Debt-to-Equity Ratio
The debt-to-equity ratio is a simple financial measurement that shows how much of your business is funded by loans, i.e., debt, versus how much is funded by your own money or your investors’ money. It’s calculated like this:
Debt-to-equity ratio = Total Liabilities ÷ Total Equity
If your business owes ₦2,000,000 and your equity, i.e., what you or shareholders own, is ₦1,000,000,
2,000,000 ÷ 1,000,000 = 2:1
your debt-to-equity ratio will be 2:1.
This means you’ve borrowed twice as much as you own. It’s like checking whether you’re growing your business more by borrowing or by using your own money. A lower ratio means you rely more on your funds, which is safer, while a higher ratio means you depend more on borrowed money, which is more risky. These numbers are very important for banks and investors because they want to know how risky it is to lend you money or invest in your business.
13. Return on Equity
Return on Equity (ROE) shows how effectively a business is using the money invested by its owners or shareholders to generate profit. It’s a key indicator of financial performance and answers a simple question: For every ₦1 invested, how much profit are we making? It’s calculated like this:
ROE = Net Income ÷ Shareholders’ Equity
If your net income is ₦500,000 and your shareholders’ equity is ₦2,000,000, your ROE is 25%. That means you're earning 25 kobo for every ₦1 of equity. That’s a strong ROE, which means your business is doing a good job of turning investment into profit. Investors and founders often use it to measure growth potential, efficiency, and the overall value your business is creating. Low or negative ROE could signal underperformance or the need to rethink how capital is being used.
14. Working Capital
Working capital is the money your business has left over after covering its short-term debts. In other words, it’s the cash cushion that helps you pay for daily operations, like paying suppliers, staff, and bills, without needing extra funding. It’s calculated like this:
Working Capital = Current Assets – Current Liabilities
If your current assets, like cash, inventory, and unpaid invoices, total ₦500,000 and your current liabilities, like payroll and vendor bills, are ₦300,000, your working capital is ₦200,000. That’s a positive working capital, which means you can handle your short-term expenses and keep your business running smoothly. If it’s negative, you may struggle to pay bills or seize growth opportunities. It’s a clear signal of your business’s day-to-day financial health.
Why Financial KPIs Matter in Everyday Business Growth
Financial KPIs (Key Performance Indicators) are more than just numbers on a spreadsheet; they’re the pulse of your business. They help you move beyond surface-level success, like getting a lot of orders, to understand the true health and sustainability of your operations.

Financial KPIs reveal your actual profitability.
You might be making sales, but are you keeping any money after covering costs? Metrics like gross and net profit margins show you what’s left over after the bills are paid, so you’re not just busy, you’re profitable.
Financial KPIs help you make smarter decisions.
Financial KPIs act like a filter. Instead of guessing what’s working, they give you clarity. If a product isn’t selling or a campaign isn’t converting, the numbers tell you when to stop, pivot, or double down by saving you time, energy, and money.
They drive intentional growth.
Growth isn’t just about getting bigger; it’s about scaling wisely. KPIs like customer acquisition cost (CAC), churn rate, and lifetime value (LTV) help you understand if you’re growing sustainably or setting yourself up for future losses.
They lower your stress level.
When you understand your break-even point, cash flow, and margins, you stop operating in fear. You’re not guessing whether you can pay bills or afford a new hire; you’re working with facts. That confidence brings peace of mind.
Financial KPIs build credibility.
Whether you're pitching to investors, applying for a loan, or partnering with another business, strong financial KPIs show you're not just running an online store, but you’re building a solid business in which customers can trust those who know their numbers.
Financial KPIs Overview of Business Growth in Nigeria
The business growth in Nigeria presents a complex and often harsh reality for entrepreneurs, particularly within the micro, small, and medium enterprise (MSME) sector. While MSMEs are undeniably the backbone of the Nigerian economy, accounting for a staggering 96% of all businesses, contributing roughly 48% to the country’s GDP, and providing about 84% of jobs, the path to sustained success remains riddled with challenges.
The growth in MSME numbers, rising from approximately 39.6 million in 2021 to over 40 million today, reflects the resilience and entrepreneurial spirit of Nigerians. Yet, beneath this growth lies a sobering truth: survival is not guaranteed. Nearly half of these businesses fail within their first year, and a daunting 95% do not survive beyond five years. The leading cause for this high failure rate is the lack of consistent demand, which affects more than 40% of these businesses. In Nigerian businesses where consumer purchasing power is unstable and market predictability is low, this challenge is particularly crippling.
The situation is further compounded by Nigeria’s broader economic pressures. By 2025, about 30% of registered MSMEs had shut down operations, citing inflation, currency devaluation, and operational difficulties as major factors. Infrastructural problems like unreliable electricity, poor road networks, and insufficient support systems weigh heavily on these businesses, while exorbitant lending rates restrict access to capital that could spur growth or rescue struggling operations.
A look into the informal business sector also reveals troubling statistics. Nearly 79% of informal enterprises earn less than ₦250,000 per month, and 90% earn under ₦500,000. This is barely enough to cover operational costs, let alone generate profit or invest in growth. The origin of many of these businesses is rooted in necessity rather than opportunity; over 51% of them were born out of unemployment, highlighting the lack of formal job creation and the entrepreneurial struggle as a survival mechanism.
Interestingly, female entrepreneurs are a notable force in this space, owning about 39% of all SMEs in Nigeria. This figure surpasses the average across sub-Saharan Africa and speaks volumes about the role of women in driving grassroots economic activity, often despite limited access to funding, mentorship, or institutional support.
In essence, while the MSME landscape in Nigeria is vast and full of potential, it is also deeply challenged. The statistics paint a picture of an ecosystem that thrives on grit and necessity but is starved of the structural support needed for long-term sustainability. Bridging the gap between ambition and success will require not just individual effort but systemic changes in infrastructure, policy, financing, and market access.

In Summary
Financial KPIs aren’t just abstract figures; they’re the heartbeat of a business that wants to thrive, not just survive. In Nigeria, where margins are thin and challenges are real, having the right insights at the right time can make all the difference. That’s where Tradift becomes more than a platform; it becomes your business partner.
With Tradift, you're not buried in spreadsheets; instead, you make data-driven decisions in real-time, tracking what sells, what converts, what returns, and what drives loyal customers back. Every click, every cart, every purchase tells a story, and Tradift helps you read it. This is your chance to turn raw numbers into great and faster moves. Stop guessing and start scaling to take control of your business journey with outstanding clarity, strong confidence, and significant impact.
